

People are searching Google more than ever, and the patterns tell an interesting story.
Between 8.5 and 13.6 billion searches happen every single day on Google in 2025. That’s roughly 99,000 queries every second, painting a real-time picture of what the world wants to know, buy, watch, and explore. For marketers and business owners, this massive dataset is gold. It shows you exactly what your audience cares about right now, where content gaps exist, and which trends are worth riding.
This year looks different from previous ones. AI Overviews and AI Mode are now widely available, changing how people phrase their queries and interact with search results. Over 1.5 billion people see AI-powered answers monthly, and conversational searches like “tell me about” and “how do I” have surged.
We’ve compiled the most comprehensive analysis of 2025’s top Google searches, combining data from multiple authoritative sources to give you actionable insights you won’t find anywhere else. This isn’t just a list of popular keywords. It’s a deep dive into search behavior, regional differences, trending topics, and what all of this means for your SEO strategy heading into 2026.
Key Takeaways
- YouTube dominates with 1.17 billion monthly searches globally.
- 91.8% of all queries are long-tail, not branded terms.
- AI Overviews reach 1.5 billion users monthly worldwide.
- Mobile accounts for 60% of searches in 2025.
- Question-based queries grew significantly with conversational AI features.
Why top Google searches in 2025 look different
The scale of Google Search continues to explode. According to Exploding Topics, we’re looking at approximately 13.6 billion searches per day, translating to nearly 5 trillion searches annually. Other analyses, including data from SEO.ai, estimate around 8.5 billion daily searches and roughly 2 trillion per year, with about 99,000 searches happening every second.
These estimates differ because they’re based on different data sources and modeling approaches, but the consensus is clear: search volume has never been higher.
What makes 2025 unique is that this is the first full year with AI Overviews and AI Mode available to a massive global audience. Google reports that these features have fundamentally changed how people interact with search. The traditional “10 blue links” experience now competes with AI-generated summaries, multi-step reasoning, and conversational follow-ups.
This shift affects everything from query length to user expectations. People are typing longer, more natural questions instead of truncated keyword phrases. They’re expecting direct answers, not just a list of websites to visit. And they’re using search in ways that blur the line between asking a search engine and talking to an AI assistant.
How this report was built
Data Sources & Methodology:
This analysis combines multiple authoritative data sources to give you the most accurate picture of 2025’s search landscape:
Primary Sources:
- Ahrefs Top Google Searches (November 2025) for top 100 queries in US and globally
- Ahrefs Top Google Questions (November 2025) for question-type queries
- Google Trends Year in Search 2025 for trending topics across key countries
- Official Year in Search 2025 blog explaining behavior shifts
- Backlinko keyword studies analyzing 306 million keywords for long-tail patterns
- Google’s AI in Search blog covering AI Overviews impact

Important Distinctions:
“Most searched” lists measure highest average monthly search volume. These are the queries people type most frequently, dominated by branded navigational terms.
“Trending” lists from Year in Search measure the biggest sustained spike versus the previous year. A query can trend massively without having the highest overall volume if it grew significantly from a smaller base.
Data Quality Notes:
All lists have been filtered to remove NSFW content, obvious typos, and repetitive variations. Keyword Difficulty (KD) scores range from 0-100, with higher scores indicating more competitive SERPs. Search volumes represent estimated monthly averages.
Coverage Period: Data reflects search behavior from January through November 2025, with trending data comparing year-over-year growth.
Global top Google searches by volume in 2025
Short-head keywords that dominate worldwide
The highest-volume searches globally remain dominated by branded navigational queries. People aren’t typing these because they don’t know the URL. They’re using Google as their browser’s address bar, a habit that’s persisted for years despite direct navigation being faster.
Top 20 Global Searches by Volume:
| Rank | Keyword | Monthly Volume | KD | Intent |
|---|---|---|---|---|
| 1 | youtube | 1,179,300,250 | 100 | Navigational |
| 2 | 784,001,300 | 100 | Navigational | |
| 3 | whatsapp web | 554,274,130 | 95 | Navigational |
| 4 | 462,780,070 | 100 | Navigational | |
| 5 | 420,406,800 | 100 | Navigational | |
| 6 | gmail | 327,000,690 | 100 | Navigational |
| 7 | google translate | 314,623,190 | 100 | Utility |
| 8 | amazon | 285,039,510 | 100 | Transactional |
| 9 | restaurant | 277,611,320 | 96 | Local |
| 10 | weather | 263,568,760 | 99 | Informational |
| 11 | 163,671,750 | 100 | Navigational | |
| 12 | hotmail | 122,217,360 | 100 | Navigational |
| 13 | canva | 120,107,070 | 100 | Navigational |
| 14 | 105,219,660 | 100 | Navigational | |
| 15 | roblox | 102,958,660 | 100 | Navigational |
| 16 | yahoo | 102,276,590 | 100 | Navigational |
| 17 | restaurants near me | 101,000,050 | 63 | Local |
| 18 | netflix | 96,299,210 | 100 | Navigational |
| 19 | nba | 82,220,560 | 100 | Informational |
| 20 | instagram login | 79,641,640 | 100 | Navigational |
Note: Most searches are branded navigational queries, not generic informational terms
The dominance of platform names makes sense when you consider user behavior. Typing “youtube” into Google’s omnisearch box has become muscle memory for billions of users. It’s faster than typing the full URL, and Google’s autocomplete helps with typos.
Non-branded utility and informational searches
When we filter out branded navigational queries, a different picture emerges. These are the searches people make when they need something done, want information, or are looking for local services.
Top Non-Branded Searches Globally:
| Keyword | Monthly Volume | KD | Primary Intent |
|---|---|---|---|
| weather | 263,568,760 | 99 | Informational |
| restaurant | 277,611,320 | 96 | Local |
| google translate | 314,623,190 | 100 | Utility |
| food near me | 75,869,830 | 84 | Local |
| map | 75,287,480 | 100 | Navigational/Utility |
| speed test | 70,286,850 | 94 | Utility |
| hotels | 43,808,400 | 98 | Transactional |
| news | 41,869,800 | 100 | Informational |
| calculator | 46,998,080 | 95 | Utility |
| google maps | 53,711,720 | 100 | Navigational/Utility |
Note: These queries represent practical needs rather than brand searches
These utility searches represent massive opportunity for businesses. A search for “restaurant” or “food near me” indicates immediate commercial intent. Someone searching “weather” might be planning activities, travel, or outdoor events, all of which connect to various business categories.
Transactional and shopping intent searches
While these don’t crack the absolute top globally, transactional queries represent the highest commercial value per search. These are people ready to buy, book, or sign up.
High Commercial Intent Searches:
| Keyword | Monthly Volume | KD | Category |
|---|---|---|---|
| amazon | 285,039,510 | 100 | E-commerce |
| walmart | 68,250,770 | 88 | E-commerce |
| ebay | 58,950,000 | 100 | E-commerce |
| shein | 59,789,950 | 99 | E-commerce |
| hotels | 43,808,400 | 98 | Travel |
| airbnb | 41,964,670 | 100 | Travel |
| amazon prime | 44,658,700 | 100 | Subscription |
| home depot | 40,796,850 | 98 | Retail |
Note: High competition but extremely valuable for conversion optimization
E-commerce platforms dominate this category, but notice the presence of category terms like “hotels” alongside brand names. This indicates that many searchers are still in discovery mode, comparing options rather than heading directly to a known brand.
Start Your Keytomic Trial Today!
Don’t rely on guesswork and outdated SEO strategies. Let Keytomic automate your SEO workflows so you can focus on what matters most — your brand.
Cancel Anytime. 14-Day Money Back Guarantee.

Trending versus most searched in Year in Search 2025
What Year in Search actually measures
Google’s Year in Search doesn’t simply list the highest-volume queries. Instead, it identifies searches with the largest sustained growth compared to the previous year. A query that went from 100,000 to 1 million searches shows up as “trending” even though terms with 10 million searches might rank higher in absolute volume.
This distinction matters because trending searches reveal what’s new, what’s captured public attention, and where cultural moments are happening. The highest-volume searches tend to be stable, predictable, and difficult to capitalize on. Trending searches represent opportunities.
Year in Search 2025 organizes trending queries into categories: general searches, news, people, passings, entertainment, sports, and more. Each category tells a different story about what captured global attention this year.
Global breakout searches in 2025
AI & Technology Trends:
The explosion of AI tools continued into 2025. Searches for “ChatGPT” remained massive, but new entrants like “Gemini” and “DeepSeek” showed significant growth. Questions like “how to use ChatGPT” and “what is generative AI” surged as mainstream adoption accelerated.
Visual search tools also trended, with Google noting that 1.5 billion people now use Google to search what they see every month through camera and screenshot inputs.
Major News & Events:
Political events, climate crises, and global conflicts drove enormous search spikes. Queries around major elections, policy changes, and economic developments dominated news-related searches across most countries.
Entertainment & Culture:
New show releases, major film premieres, and viral cultural moments created predictable spikes. Sports tournaments, particularly international competitions and championship games, generated massive search volume during their active periods.
Classic branded navigational queries at the top of volume lists barely move year to year. YouTube, Facebook, and Google maintain their positions. The action happens in trending searches where new topics emerge and capture attention.
Country snapshots of what people searched in 2025
United States search behavior in 2025
Top 20 US Searches by Volume:
| Rank | Keyword | Monthly Volume | KD |
|---|---|---|---|
| 1 | youtube | 151,000,000 | 86 |
| 2 | 124,000,000 | 87 | |
| 3 | amazon | 124,000,000 | 81 |
| 4 | weather | 101,000,000 | 66 |
| 5 | restaurant | 68,000,000 | 46 |
| 6 | 68,000,000 | 88 | |
| 7 | food near me | 68,000,000 | 59 |
| 8 | gmail | 55,600,000 | 94 |
| 9 | target | 45,500,000 | 76 |
| 10 | hotel | 45,500,000 | 38 |
| 11 | yahoo | 30,400,000 | 91 |
| 12 | translate | 37,200,000 | 82 |
| 13 | google translate | 37,200,000 | 96 |
| 14 | fox news | 37,200,000 | 89 |
| 15 | nfl | 30,400,000 | 79 |
| 16 | 30,400,000 | 89 | |
| 17 | chatgpt | 30,400,000 | 86 |
| 18 | walmart | 24,900,000 | 65 |
| 19 | 24,900,000 | 89 | |
| 20 | starbucks | 24,900,000 | 67 |
Data shows strong preference for shopping, local services, and AI tools
US-Specific Insights:
The American search landscape reflects a mix of convenience-seeking and information-hunting. “Food near me” searches remain massive, indicating the continued dominance of mobile search for immediate local needs. The presence of “Target,” “Walmart,” and “Amazon” in the top 10 shows retail searches are habitual.
ChatGPT appearing in the top 20 marks a significant shift. This represents mainstream adoption of AI tools beyond tech-savvy early adopters. Searches for “how to use ChatGPT,” “ChatGPT prompts,” and “is ChatGPT free” all showed significant volume.
Sports queries, particularly NFL-related terms, spike dramatically during the season but maintain year-round baseline volume. “NFL scores,” “NFL games today,” and team-specific searches represent massive collective search volume.
United Kingdom and Europe highlights
Top 20 UK Searches:
| Rank | Keyword | Monthly Volume | KD |
|---|---|---|---|
| 1 | bbc news | 55,600,000 | 91 |
| 2 | youtube | 37,200,000 | 91 |
| 3 | 30,400,000 | 81 | |
| 4 | weather | 24,900,000 | 67 |
| 5 | 20,400,000 | 75 | |
| 6 | daily mail | 20,400,000 | 79 |
| 7 | amazon | 20,400,000 | 72 |
| 8 | restaurant | 13,600,000 | 45 |
| 9 | gmail | 13,600,000 | 92 |
| 10 | premier league | 11,100,000 | 87 |
| 11 | translate | 11,100,000 | 85 |
| 12 | ebay uk | 9,140,000 | 78 |
| 13 | ebay | 9,140,000 | 81 |
| 14 | bbc football | 9,140,000 | 85 |
| 15 | google map | 9,140,000 | 91 |
| 16 | argos | 9,140,000 | 55 |
| 17 | yahoo mail | 7,480,000 | 83 |
| 18 | weather tomorrow | 7,480,000 | 60 |
| 19 | mcdonald’s | 7,480,000 | 62 |
| 20 | hotel | 7,480,000 | 44 |
BBC News dominates UK searches, reflecting strong news consumption habits
UK search behavior differs notably from the US. BBC News claiming the top spot shows the continued importance of traditional media. The Premier League generates enormous search volume year-round, with spikes during match days.
UK-specific retailers like Argos, Tesco, and Sainsbury’s feature prominently in local search volumes. Questions about “weather tomorrow” get significantly more searches in the UK than the US, possibly reflecting the country’s notoriously unpredictable climate.
Canada search trends in 2025
Top 20 Canadian Searches:
| Rank | Keyword | Monthly Volume | KD |
|---|---|---|---|
| 1 | youtube | 24,900,000 | 100 |
| 2 | 20,400,000 | 99 | |
| 3 | weather | 11,100,000 | 90 |
| 4 | restaurant | 11,100,000 | 54 |
| 5 | 11,100,000 | 96 | |
| 6 | amazon canada | 11,100,000 | 92 |
| 7 | amazon | 11,100,000 | 99 |
| 8 | tim hortons | 9,140,000 | 82 |
| 9 | wordle | 9,140,000 | 91 |
| 10 | gmail | 9,140,000 | 100 |
| 11 | nhl | 7,480,000 | 100 |
| 12 | google translate | 7,480,000 | 100 |
| 13 | chatgpt | 7,480,000 | 94 |
| 14 | canada post | 7,480,000 | 92 |
| 15 | walmart | 6,120,000 | 75 |
| 16 | translation | 6,120,000 | 93 |
| 17 | nhl scores | 6,120,000 | 91 |
| 18 | google map | 6,120,000 | 99 |
| 19 | mcdonald’s | 5,000,000 | 86 |
| 20 | costco | 5,000,000 | 86 |
Tim Hortons ranks #8, showing the power of local brand loyalty
Canadian search patterns blend American influences with distinct local preferences. Tim Hortons appearing in the top 10 reflects its cultural significance beyond just being a coffee chain. NHL searches remain strong year-round, with massive spikes during playoffs.
Government-related searches like “CRA login” (Canada Revenue Agency) spike during tax season but maintain baseline volume. “Canada Post tracking” sees consistent searches, reflecting e-commerce growth.
Bilingual search behavior exists but primarily in Quebec. English remains dominant for most search volume across the country.
Australia search trends in 2025
Top 20 Australian Searches:
| Rank | Keyword | Monthly Volume | KD |
|---|---|---|---|
| 1 | youtube | 13,600,000 | 100 |
| 2 | 9,140,000 | 98 | |
| 3 | wordle | 6,120,000 | 85 |
| 4 | weather | 6,120,000 | 85 |
| 5 | restaurant | 6,120,000 | 51 |
| 6 | 6,120,000 | 93 | |
| 7 | channel 9 | 6,120,000 | 99 |
| 8 | mygov | 5,000,000 | 83 |
| 9 | kmart | 5,000,000 | 82 |
| 10 | 7 news | 5,000,000 | 93 |
| 11 | map | 4,090,000 | 98 |
| 12 | chatgpt | 4,090,000 | 96 |
| 13 | bunnings | 4,090,000 | 85 |
| 14 | afl | 4,090,000 | 89 |
| 15 | woolworths | 3,350,000 | 74 |
| 16 | translate | 3,350,000 | 100 |
| 17 | nrl | 3,350,000 | 94 |
| 18 | jb hi-fi | 3,350,000 | 82 |
| 19 | google translate | 3,350,000 | 100 |
| 20 | coles | 3,350,000 | 74 |
Bunnings, Woolworths, and Coles show strong local retail search behavior
Australian search behavior showcases unique local brands. Bunnings (hardware), Woolworths and Coles (groceries), Kmart (retail), and JB Hi-Fi (electronics) all rank highly, showing strong domestic brand loyalty.
Sports searches split between AFL (Australian Football League) and NRL (National Rugby League), with regional preferences. AFL dominates in southern states, while NRL leads in New South Wales and Queensland.
MyGov searches remain consistently high as Australians access government services online. The Bureau of Meteorology (BOM) gets significant search volume for weather forecasts and radar.
Pakistan search trends in 2025
According to Google’s Year in Search 2025 for Pakistan, the top trending searches revealed unique local concerns and interests:
Top Trending Searches in Pakistan:
| Rank | Trending Query | Category |
|---|---|---|
| 1 | punjab socio economic registry | Government/Policy |
| 2 | karachi floods | Weather/Crisis |
| 3 | iran | International |
| 4 | asaan karobar card | Business/Policy |
| 5 | flood situation near chenab | Weather/Crisis |
| 6 | board exam results | Education |
| 7 | gold rates | Economy |
| 8 | laptop scheme | Government/Policy |
| 9 | cricket matches | Sports |
| 10 | currency exchange rates | Economy |
Pakistan searches reflect economic concerns, climate events, and policy changes
Key Insights:
Pakistani search behavior in 2025 reflected significant economic stress and climate concerns. Queries about gold rates, currency exchange rates, and government assistance programs like the laptop scheme dominated trending topics.
Weather-related searches spiked dramatically with devastating floods in Karachi and along the Chenab River. These weren’t just informational queries but crisis-driven searches for safety information, relief resources, and updates.
Government policy searches showed people actively engaging with new programs. The Punjab Socio-Economic Registry and Asaan Karobar (Easy Business) Card represented economic initiatives that drove significant search interest.
Education remains a top priority with consistent searches for board exam results, university admissions, and scholarship programs. Cricket-related queries maintain year-round volume with spikes during international matches.
What people actually asked Google in 2025
The most asked questions on Google
According to Ahrefs’ analysis of 100 most asked questions in 2025, question-based queries show different patterns than keyword searches. These tend to be longer, more conversational, and often reflect immediate needs or confusion about specific topics.
Top 20 Most Asked Questions Globally:
| Rank | Question | Monthly Volume | Intent Type |
|---|---|---|---|
| 1 | how to screenshot | 18,500,000 | How-to/Tutorial |
| 2 | how to tie a tie | 14,200,000 | How-to/Tutorial |
| 3 | what is my ip | 12,800,000 | Informational |
| 4 | how to delete instagram account | 11,900,000 | How-to/Account |
| 5 | how to lose weight | 10,500,000 | How-to/Health |
| 6 | what is love | 9,800,000 | Philosophical |
| 7 | how to draw | 9,200,000 | How-to/Skill |
| 8 | how to make money online | 8,900,000 | How-to/Financial |
| 9 | how to get rid of hiccups | 8,100,000 | How-to/Health |
| 10 | what time is it | 7,600,000 | Informational |
| 11 | how to get free robux | 7,400,000 | How-to/Gaming |
| 12 | how to write a check | 6,900,000 | How-to/Financial |
| 13 | what is bitcoin | 6,500,000 | Definitional |
| 14 | how to boil eggs | 6,200,000 | How-to/Cooking |
| 15 | what is chatgpt | 5,900,000 | Definitional |
| 16 | how to clear cache | 5,700,000 | How-to/Tech |
| 17 | what is vpn | 5,400,000 | Definitional |
| 18 | how to download youtube videos | 5,100,000 | How-to/Tech |
| 19 | how much water should i drink | 4,800,000 | Health/Advice |
| 20 | how to delete facebook account | 4,600,000 | How-to/Account |
Note: Questions show practical, immediate needs rather than brand navigation
Common Themes:
How-to queries dominate the list, representing people seeking instructions for tasks ranging from basic (tying a tie) to complex (making money online). These searches indicate content opportunities for step-by-step guides and tutorials.
Account management questions like deleting Instagram or Facebook accounts show users struggling with platform navigation. This represents frustration with complex settings or deliberate friction in offboarding processes.
Health and wellness questions remain perennial, from losing weight to hiccup remedies to water intake. These queries often lead to low-quality content farms, creating opportunities for authoritative health content.
Technology definitions reflect rapid change. “What is ChatGPT” entering the top 20 shows how quickly AI tools went mainstream. Similar patterns exist for VPN, Bitcoin, and other emerging technologies.
Growth in question and conversational queries
Google’s Year in Search 2025 blog noted significant growth in conversational query patterns. Phrases like “tell me about” and “how do I” increased substantially compared to previous years.
This shift correlates directly with AI Overviews’ rollout. When users see AI-generated answers, they adapt their query style to be more conversational, expecting dialogue rather than just link retrieval.
Voice search continues driving this trend. According to Embryo’s research, 55% of millennials use voice search daily. Voice queries are naturally longer and more conversational: “What’s the weather like today” instead of “weather.”
Smart speakers, voice assistants in cars, and mobile voice search have normalized talking to search engines. The distinction between asking Google a question and asking Alexa or Siri has blurred, and query patterns now reflect that convergence.
Start Your Keytomic Trial Today!
Don’t rely on guesswork and outdated SEO strategies. Let Keytomic automate your SEO workflows so you can focus on what matters most — your brand.
Cancel Anytime. 14-Day Money Back Guarantee.
Long-tail, voice and conversational search in 2025
Why most queries are long-tail even if the lists show short-head terms
Here’s something that might surprise you: despite top search lists being dominated by one or two-word queries, Backlinko’s analysis of 306 million keywords found that approximately 91.8% of all search queries are long-tail.
Long-tail keywords are typically defined as phrases with lower search volume and higher specificity. Instead of “shoes,” a long-tail query might be “comfortable running shoes for flat feet women.”
Why This Matters:
These long-tail queries collectively represent enormous opportunity. While “iPhone” might get millions of searches, thousands of variations like “iPhone 17 pro max release date,” “iPhone battery replacement cost,” and “iPhone vs Samsung Galaxy comparison” combine for massive total volume.
More importantly, long-tail queries often show clearer intent. Someone searching “shoes” could want anything. Someone searching “comfortable running shoes for flat feet women size 8” knows exactly what they need and is closer to making a purchase.
The dominance of short-head terms in top 100 lists creates a misleading impression. These lists show the most searched individual terms, but the long tail is where most actual search activity happens.
Voice search and question phrases
Voice search has fundamentally changed query structure. When typing, people economize: “weather chicago.” When speaking, they use natural language: “What’s the weather like in Chicago today?”
Embryo’s research shows 55% of millennials use voice search daily. This number climbs even higher for Gen Z users and continues growing as voice technology improves.
Voice queries tend to be:
- Longer: Average of 3-5 words for typed queries vs 6-10 words for voice
- More conversational: Natural sentence structure instead of keyword strings
- Question-based: Start with who, what, where, when, why, or how
- Local-focused: Higher percentage include “near me” or location references
Google’s AI in Search blog noted that people now use Search in “more conversational ways” as AI features like AI Overviews and AI Mode become standard. This trend will only accelerate as AI capabilities improve and users become more comfortable with conversational interfaces.
How AI changed Google searches in 2025
AI Overviews, AI Mode and 1.5 billion people each month
2025 marked the first full year of widespread AI Overviews availability. Google describes this as “one of the most successful launches in Search,” and the numbers support that claim.
Over 1.5 billion people per month now see AI Overviews in their search results. In major markets like the United States and India, AI Overviews drives more than a 10% increase in search usage for queries that show these AI-generated summaries.
What Are AI Overviews?
AI Overviews are AI-generated summaries that appear above traditional search results. They synthesize information from multiple sources, providing direct answers with citations. For many queries, users get what they need without clicking any links.
AI Mode:
AI Mode takes this further, allowing users to ask follow-up questions, request summaries, and engage in multi-step reasoning directly within Search. It’s essentially conversational AI embedded into the search experience.
Impact on Search Behavior:
This has changed several aspects of how people search:
- Query structure shifted toward questions: Users phrase searches more conversationally when they expect AI-generated answers
- Follow-up queries increased: The ability to ask follow-ups without starting a new search encourages deeper exploration
- Zero-click searches grew: Many users find answers in AI Overviews without visiting any websites
- Longer sessions with fewer site visits: Users spend more time on Google’s SERP engaging with AI-generated content
For content creators and SEOs, this represents both challenge and opportunity. Being cited in AI Overviews can drive authority and awareness, even if direct click traffic decreases.
Visual and multimodal search
Another major shift in 2025: 1.5 billion people now use Google to search what they see every month, according to Google’s own reporting. This includes searches via camera (Google Lens), screenshots, and image uploads.
Use Cases:
- Shopping: Point your camera at a product to find where to buy it
- Translation: Photograph signs or menus for instant translation
- Plant and animal identification: Snap a photo to learn what something is
- Homework help: Screenshot a math problem for step-by-step solutions
- Fashion and style: Find similar items or identify brands from photos
Multimodal AI experiences combine text, image, and sometimes voice inputs in a single query. You might search with both an image and the text “but in blue” to find color variations of a photographed item.
This fundamentally changes SEO requirements. Optimizing for visual search means:
- High-quality product photography with clear, detailed images
- Descriptive alt text that actually describes image content
- Structured data markup for products, recipes, articles
- Video content optimized for key moments extraction
Mobile drives most of this behavior. Pointing your phone’s camera at something to search is intuitive and fast, especially for younger users who grew up with smartphones.
Device split and context for searches
Mobile has definitively won the device wars for search. Multiple traffic studies show mobile accounting for approximately 60% of web traffic in 2025, with higher percentages in emerging markets like India and Pakistan.
Mobile vs Desktop Query Differences:
Mobile searches show:
- Higher percentage of local queries (“near me” searches)
- More voice-activated searches
- Shorter session times but higher frequency
- More visual searches (camera, screenshots)
- Higher use of apps vs web browsers
- Peak usage during commute times and evenings
Desktop searches show:
- Longer, more complex research queries
- Higher engagement with detailed content
- More comparison shopping and B2B research
- Professional and work-related searches during business hours
- Higher likelihood of completing complex transactions
Why This Matters:
Your content strategy needs to account for these differences. Mobile users want quick answers and easy navigation. Desktop users will tolerate (and sometimes prefer) longer, more comprehensive content.
Page speed matters dramatically more on mobile, where users are often on slower connections. A site that loads slowly on 4G will hemorrhage mobile traffic regardless of content quality.
Local businesses especially need mobile-optimized experiences.
Someone searching “coffee shop near me” on their phone wants addresses, hours, phone numbers, and directions. They’re not reading your brand story or company history.
What this means for your SEO strategy in 2026
Stop chasing the very top keywords
Looking at these top 100 lists might be tempting. YouTube gets over a billion searches monthly. Shouldn’t you try to rank for it?
No. Trying to rank for “YouTube,” “Facebook,” or “Google” makes zero sense. These queries have 100 keyword difficulty scores for a reason. The first page is entirely dominated by the brands themselves and major news outlets covering them.
More importantly, even if you could somehow rank, what would be the point? Anyone searching “YouTube” wants YouTube.com, not an article about YouTube.
What You Should Do Instead:
Treat top 100 lists as context, not targets. They show you what people care about at scale, but your opportunity lies in the variations, questions, and long-tail searches around these topics.
Instead of targeting “YouTube,” target:
- “How to grow a YouTube channel in 2026”
- “YouTube algorithm explained”
- “Best YouTube video length for monetization”
- “YouTube vs TikTok for businesses”
These are searchable, rankable, and actually valuable if someone finds your content.
Build strategy around the trends behind the searches
Year in Search categories reveal themes worth building content clusters around. The top searches themselves might be unreachable, but the ecosystem around them offers opportunities.
AI Tools Theme:
ChatGPT searches exploded, but so did thousands of related queries:
- “[specific task] with ChatGPT”
- “ChatGPT vs [competitor]”
- “ChatGPT prompts for [use case]”
- “How to use ChatGPT for [industry]”
Build comprehensive content addressing these variations. You won’t rank for “ChatGPT,” but you might dominate several high-value long-tail variations.
Climate and Weather Theme:
Weather remains a top search, but local variations, seasonal queries, and climate impact searches offer opportunities:
- “Best time to visit [location]”
- “How [weather event] affects [activity/industry]”
- “Climate change impact on [specific concern]”
- “[Season] weather patterns explained”
Economic Stress Theme:
Searches for gold rates, currency exchange, and financial assistance programs spike during economic uncertainty:
- “How to protect savings during inflation”
- “Best investment strategies for [economic condition]”
- “Understanding [specific economic indicator]”
- “Government assistance programs for [situation]”
Identify themes from trending data, then build content ecosystems that thoroughly address user questions around those themes.
Win the long-tail and the questions
Remember: 91.8% of queries are long-tail. This is where opportunity lives.
Strategies for Long-Tail Domination:
1. Question-focused content: Create comprehensive answers to common questions in your niche. Use Ahrefs’ question database or tools like AnswerThePublic to find what people ask.
2. FAQ sections: Every product page, service page, and informational article should have a robust FAQ section. These capture question-based queries and often appear in AI Overviews.
3. Comparison content: “X vs Y” queries are inherently long-tail and show high commercial intent. Cover all relevant comparisons in your space.
4. Specific how-to guides: Generic guides get buried. Specific guides like “How to [task] for [specific situation/user type]” face less competition.
5. Structured data: Implement FAQ schema, How-To schema, and other structured data types. This helps your content get featured in AI Overviews and rich results.
Optimize for AI, visual and mobile-first behavior
The search landscape has changed. Optimizing for 2026 means adapting to AI-generated results, visual search, and mobile dominance.
For AI Overviews:
- Create clear, concise summaries at the start of your content
- Use descriptive headers that directly answer questions
- Structure content logically with clear hierarchy
- Cite authoritative sources when making claims
- Focus on accuracy and comprehensiveness
For Visual Search:
- Use high-quality images with descriptive file names
- Write detailed, accurate alt text for every image
- Include infographics and data visualizations
- Optimize images for mobile viewing
- Implement product structured data
For Mobile Users:
- Prioritize page speed ruthlessly
- Design for thumb-friendly navigation
- Put key information above the fold
- Make phone numbers and addresses clickable
- Test on actual mobile devices, not just desktop simulators
Checklist for 2026 SEO:
✓ Audit content for question-based optimization ✓ Implement comprehensive structured data ✓ Optimize all images for visual search ✓ Achieve sub-3-second mobile page load times ✓ Create clear, AI-Overview-friendly summaries ✓ Build topical authority through content clusters ✓ Monitor AI Overview appearances in search console ✓ Track mobile vs desktop performance separately ✓ Develop voice-search-friendly conversational content ✓ Stay updated on AI feature rollouts in your target markets
How to track and leverage top Google searches with automation
Keeping up with search trends manually is exhausting. The data changes constantly. New trends emerge daily. Opportunities disappear as competition increases. For most businesses, by the time you’ve researched keywords, created content, and published it, the opportunity has shifted.
This is where automation changes everything.
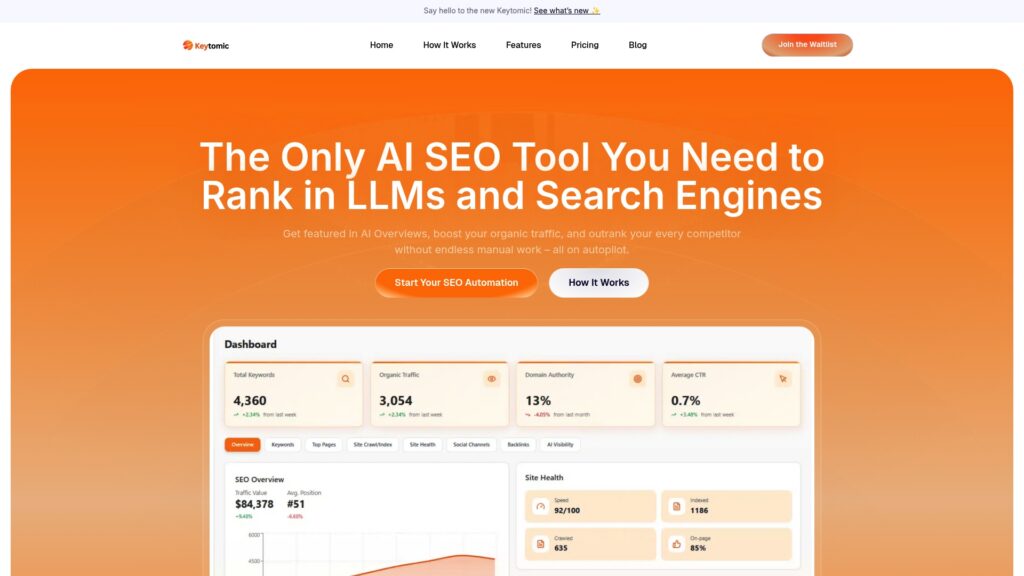
Keytomic: Automated SEO and keyword intelligence
Keytomic is an AI-powered SEO automation platform designed specifically for businesses that want to capitalize on search trends without drowning in manual keyword research and content creation.
The Core Problem Keytomic Solves:
Traditional SEO workflows look like this:
- Research keywords manually
- Analyze competition
- Create content briefs
- Write or outsource content
- Optimize for SEO
- Publish to your CMS
- Submit for indexing
- Wait weeks to see results
By the time you finish these steps for one piece of content, dozens of new opportunities have appeared and others have become too competitive. You’re always behind.
Keytomic’s Automated Approach:
Keytomic monitors trending searches, automatically generates optimized content, publishes directly to your CMS, and handles indexing across multiple platforms, all without manual intervention.
Key Features:
Automated Keyword Analysis: Keytomic continuously analyzes search trends, identifying high-opportunity keywords based on volume, difficulty, and relevance to your business. Instead of spending hours in keyword tools, you get actionable keyword targets delivered automatically.
Content Generation Based on High-Volume Searches: When Keytomic identifies an opportunity, it generates content optimized for that keyword. This isn’t generic AI slop. It’s strategically structured content that targets specific search intents with proper keyword integration.
Multi-CMS Publishing: Write once, publish everywhere. Keytomic integrates with WordPress, Webflow, and other major CMS platforms. Content goes live automatically across your properties.
Auto-Indexing Across Search Engines: Here’s where Keytomic really shines. After publishing, it automatically submits your content for indexing to Google, Bing, and ChatGPT. This dramatically accelerates when your content starts appearing in search results.
GEO (Generative Engine Optimization): This is the future of SEO. As AI Overviews and conversational AI become dominant, traditional SEO tactics lose effectiveness. GEO optimization ensures your content appears in AI-generated answers, not just traditional search results.
Real-World Use Case:
Imagine you run an e-commerce site selling outdoor gear. Keytomic notices “best hiking boots for winter 2026” is trending with increasing volume. It:
- Analyzes the keyword and related long-tail variations
- Generates a comprehensive buying guide optimized for that query
- Publishes it to your WordPress blog
- Submits it for indexing across Google, Bing, and ChatGPT
- Monitors rankings and AI Overview appearances
All of this happens automatically while you sleep. By the time you log in the next morning, the content is live, indexed, and starting to drive traffic.
Pricing transparency
Keytomic costs $99/month with a 20% discount on annual plans. Compare that to enterprise SEO tools that charge $500-2,000/month but still require massive manual work.
Most SEO platforms give you data. Keytomic gives you outcomes. You’re not paying for keyword databases and rank tracking. You’re paying for automated content that actually ranks and drives traffic.
For growing businesses, this pricing makes sense. You get enterprise-level automation at startup-friendly pricing. The ROI calculation is simple: if Keytomic generates content that brings in even a handful of qualified leads per month, it pays for itself many times over.
How Keytomic differs from manual keyword research tools
Traditional keyword tools like Semrush, Ahrefs, and Moz tell you what to do. They show you search volumes, difficulty scores, and competitor analysis. Then you still have to:
- Create content briefs
- Write or hire writers
- Optimize the content
- Publish it manually
- Remember to submit for indexing
- Track performance separately
Keytomic does the work. It’s the difference between a recipe book and a personal chef. Both help you get food, but one requires significantly less effort from you.
Other Key Differences:
Speed: Manual workflows take days or weeks. Keytomic executes in hours.
Scale: You might research and publish 2-5 articles per month manually. Keytomic can handle 20-50+, limited only by your content strategy, not your time.
Consistency: Human processes have gaps. You get busy, priorities shift, someone forgets to submit for indexing. Automation runs whether you’re working or not.
Trend Capture: By the time you spot a trend manually, research it, and create content, it might be past peak. Automation catches opportunities at the right moment.
Turning search data into rankings with Keytomic
Here’s a practical workflow for using Keytomic with the search trend data from this article:
Step 1: Identify Theme Clusters
Look at the trending searches and high-volume queries in your industry. Let’s say you’re in the AI tools space. ChatGPT, AI Overviews, and related searches dominate.
Step 2: Configure Keytomic’s Monitoring
Set up keyword monitoring for variations around these themes:
- “How to use [AI tool]”
- “[Task] with AI”
- “Best AI tools for [use case]”
- “[AI tool] vs [competitor]”
Step 3: Let Automation Run
Keytomic monitors these patterns, identifies specific opportunities (like “best AI tools for marketing 2026” gaining traction), and automatically generates content when opportunities appear.
Step 4: Review and Adjust
You don’t need to write or optimize content manually, but you should review what’s published and adjust your strategy based on what’s working. Keytomic’s dashboard shows you which automated content is driving traffic and rankings.
Step 5: Scale What Works
Once you identify winning themes, expand your monitoring to cover more variations. The automation handles the execution while you focus on strategy.
ROI Example:
A SaaS company using Keytomic to target long-tail queries around their product category might see:
- 40 pieces of optimized content published per month
- 15 ranking in top 10 within 60 days
- 2,000+ monthly organic visits from those rankings
- 50+ qualified leads per month
- Customer acquisition cost lower than paid channels
At $99/month, that’s a no-brainer ROI for most businesses.
Start Your Keytomic Trial Today!
Don’t rely on guesswork and outdated SEO strategies. Let Keytomic automate your SEO workflows so you can focus on what matters most — your brand.
Cancel Anytime. 14-Day Money Back Guarantee.
FAQs About Top Google Searches
What are the most searched things on Google in 2025?
The most searched terms on Google in 2025 are YouTube (1.17 billion monthly searches), Facebook (784 million), WhatsApp Web (554 million), Instagram (462 million), and Google itself (420 million). Social media platforms and communication tools dominate the top 10 globally.
What is the #1 most Googled thing?
YouTube is the #1 most Googled search term globally with over 1.17 billion monthly searches. This is followed by Facebook with 784 million and WhatsApp Web with 554 million monthly searches.
How do top Google searches vary by country?
Countries show distinct search patterns based on local culture and needs. BBC News dominates UK searches while Tim Hortons ranks in Canada’s top 10. Sports searches differ too: NFL leads in the US, Premier League in the UK, AFL in Australia, and cricket in India and Pakistan.
Why is YouTube the most searched term on Google?
Users habitually type “YouTube” into Google’s search bar instead of navigating directly to YouTube.com. This behavior persists despite direct navigation being faster, showing how ingrained the habit has become for billions of users worldwide.
What are “near me” searches and why are they popular?
“Near me” searches like “restaurant near me” represent local intent queries with over 101 million monthly searches globally. They’ve grown because of mobile search adoption and Google’s location-based features that deliver relevant local results instantly.
How can I use top Google searches for my SEO strategy?
Use top searches to identify content gaps in your niche, understand user intent patterns at scale, discover related long-tail keywords with lower competition, spot emerging trends before competitors, and benchmark keyword difficulty against popular terms.
What is keyword difficulty (KD) and why does it matter?
Keyword difficulty is a score from 0-100 indicating how hard it is to rank for a keyword. Higher scores mean more competition from established, authoritative sites. Top searches often have KD scores of 80-100, making long-tail variations more realistic targets.
Are top Google searches the same as top ranking keywords?
No. Top searches show what people search for most frequently, but top ranking keywords are what actually drive traffic to sites. Popular searches often have extreme competition, while strategic ranking keywords may have lower volume but better conversion potential.
How often do top Google searches change?
Core navigational searches like YouTube, Facebook, and Amazon remain stable year over year. Trending topics can change weekly or daily. Seasonal searches fluctuate monthly (Christmas shopping in December), while major events cause sudden, temporary spikes.
What are the most searched AI tools in 2025?
ChatGPT leads AI tool searches with approximately 30-40 million monthly searches depending on the country. This represents significant growth from 2024, showing mainstream adoption of AI technologies beyond early tech adopters.
How do mobile and desktop searches differ?
Mobile searches show higher percentages of local “near me” queries, voice searches, and quick informational lookups. Desktop searches lean toward longer research sessions, complex comparisons, professional tasks, and detailed product research during work hours.
What is search volume and how is it calculated?
Search volume is the estimated average monthly searches for a keyword. It’s calculated by analyzing sample data across search engines and extrapolating to represent total searches. Major SEO tools track this across billions of queries.
Can I rank for top Google searches as a small business?
Ranking for ultra-popular searches with 100+ million volume is nearly impossible for small businesses due to overwhelming competition. Instead, target long-tail variations, local versions, question-based formats, or niche angles of popular searches.
What tools can I use to track top Google searches?
Popular tools include Google Trends for trending topics, Ahrefs for search volume data, Semrush for competitive analysis, Google Search Console for your own performance, and Keytomic for automated keyword tracking and content optimization.
Why do some countries have different top searches?
Cultural differences, language variations, local businesses, regional sports leagues, dominant news sources, and country-specific services all influence what people search for. UK searches feature Premier League while US searches show NFL dominance.
What’s the difference between Google Trends and search volume data?
Google Trends shows relative popularity over time on a 0-100 scale, perfect for identifying rising or falling patterns. Search volume shows estimated actual monthly searches, quantifying total demand for specific keywords.
How can I automate keyword research for top searches?
SEO automation platforms like Keytomic continuously analyze trending searches, identify opportunities based on your business, generate optimized content automatically, and publish across multiple platforms, eliminating repetitive manual keyword research.
What are the highest commercial intent searches in the top 100?
E-commerce platforms like Amazon, eBay, and Walmart show high commercial intent. Local service searches including “restaurant near me,” “hotels near me,” and “food near me” indicate users ready to make immediate purchasing decisions.
Do top Google searches predict future trends?
Rising search volumes often indicate emerging trends 3-6 months before mainstream awareness. Monitoring month-over-month changes in search data, especially for new terms or sudden spikes, helps predict market shifts and capitalize early.
How does seasonality affect top Google searches?
Retail searches spike November-December for holidays, weather searches peak before seasonal changes, sports queries follow league schedules (NFL September-February, NBA October-June), and tax-related searches surge January-April. Plan content around predictable patterns.
Wrapping Up
Google searches in 2025 reveal a world adapting to AI integration, economic uncertainty, and rapidly changing technology. The dominance of navigational queries for platforms like YouTube and Facebook shows habitual behavior, while the explosion of AI-related searches demonstrates mainstream adoption of tools that were niche just two years ago.
For marketers and business owners, the opportunity isn’t in ranking for the most popular searches. It’s in understanding the themes, questions, and long-tail variations that represent your specific audience’s needs.